Course Overview
Introduction to Data Science (BIOL7800)
Daijiang Li
LSU
2023/08/21
Who am I?

Daijiang Li
Assistant Professor
Department of Biological Sciences
Center for Computation & Technology
https://www.dlilab.com
My role
Introuce new materials
Help you learn these materials
Help you learn how to use what we learned in your research
Help you learn how to ask for help
Be a potential future resource
My role
Third time teaching this course
My role
Third time teaching this course
I still plan to make a lot of mistakes or even fail
My role
Third time teaching this course
I still plan to make a lot of mistakes or even fail
In public
Who are you?
Introduce yourself: department, lab, research direction/interest, etc.
Go Through the Syllabus
How are we going to go through this course?
Learning by doing (through trials and errors)
Use lots of online resources
Peer-teaching and learning; collaborative coding
Google and Stack Overflow
What is data science ?
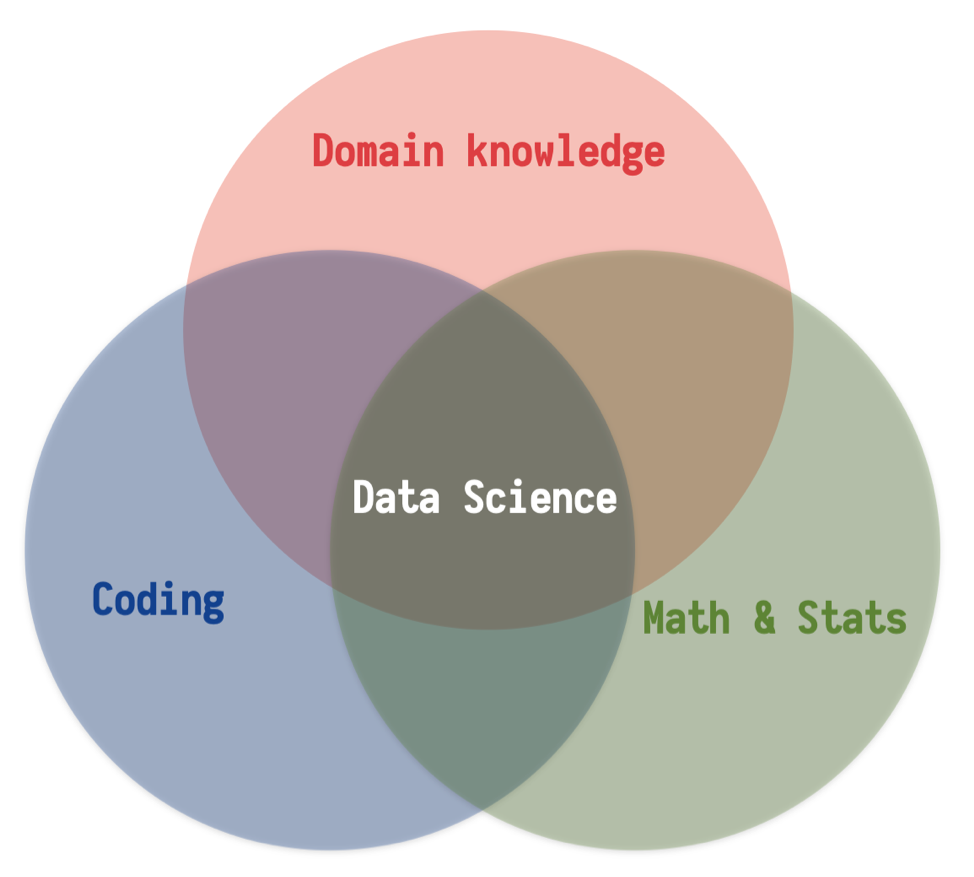
Data science is interdisciplanary
To gain insights into data through ...

Data Scientist = statistician + programmer + coach + storyteller + artist
Shlomo Aragmon
Good data science is distinguished from bad data science primarily by a repeatable, thoughtful, skeptical application of an analytic process to data in order to arrive at supportable conclusions.
Jeff Leek
Applies to every discipline
The age of big data
Between the dawn of civilization and 2003, we only created five exabytes1 of information; now we’re creating that amount every two days.
Eric Schmidt et al, Google

[1] 1 exabyte = 1 billion gigabytes
ask students what kind of large datasets exist in their field of research
Data science processes
Define the question of interest
Get the data
Clean and prepare the data
Explore the data
Fit models to extract insights
Tell, explain, and illustrate results
Data science processes
Define the question of interest
Get the data
Clean and prepare the data
Explore the data
Fit models to extract insights
Tell, explain, and illustrate results
These steps are the most time consuming ones, so better to make them (and others) reproducible
 Blitzstein & Pfister, 2015
Questions in data science
Leek & Peng 2015
Examples
| Types | Examples |
|---|---|
| Descriptive | Proportion of different races in the USA |
| Exploratory | Investigate correlations among multiple variables |
| Inferential (most common) | Does air pollution correlate with life expectancy at the state level in the USA? |
| Predictive | Using polling data to predict election results; not necessarily explain why |
| Causal | Average risk of COVID for vaccination vs non-vaccination |
| Mechanistic | Impacts of wing design on air flow over a wing; rare outside of engineering |